I’m learning Data Science with R Programming. It’s been so far an enlightening experience to say the least.
As I was completing an assessment, I stumbled at a question regarding a boxplot. In R, it’s so easy to create a boxplot. Using the function boxplot(), you can instantly stratify what you need to. My problem was not writing the code. My problem was instead understanding what exactly a boxplot was. Following is just a sample boxplot I created based on the code samples:
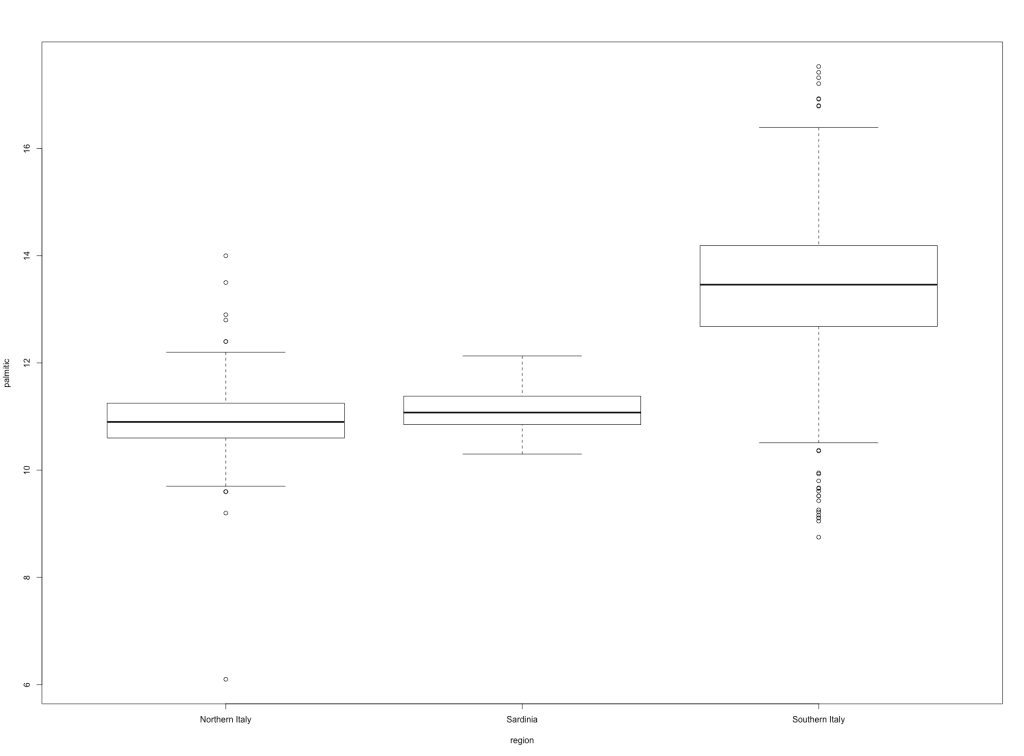
Looks nice, however, initially I had absolutely no idea what that plot was trying to tell me.
Unless I learn, how a boxplot works, I can’t really finish my learning. Upon searching, I stumbled across one of the best articles I’ve ever read on visualisations.
This post, Understanding Boxplots (Towards Data Science) by Michael Galarnyk, explains the concept in an exceptionally detailed manner.
I hope you all find it useful too.
Vaidy


